Healthchecks v5: Self-Hosted Cron Job Monitoring That Tells You When Backups Stop
Healthchecks is a BSD-licensed, self-hosted cron job monitor that alerts you when backups and scheduled tasks stop checking in. What is new in v5 and how to run it with Docker Compose.
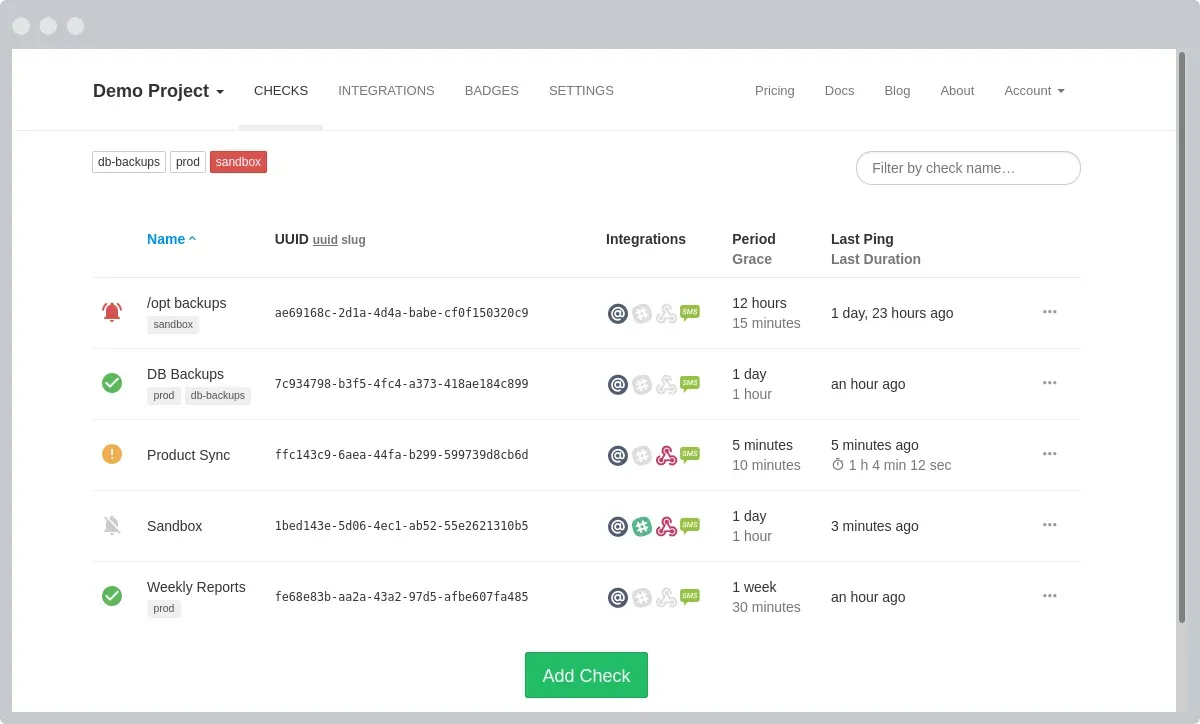
Most homelab monitoring answers one question: is this service up? Uptime checks are great for that, but they miss a whole category of failures. Your nightly backup script, the certificate renewal, the database dump, the rsync to your NAS: none of them are "services". When they silently stop running, nothing is down, and you usually find out at the worst possible moment.
Healthchecks solves exactly this problem. Instead of polling your systems, it waits for your jobs to check in. If a ping doesn't arrive on time, you get an alert. The project just shipped v5.0 (October 20, 2026) and v5.0.1 two days later, with a new web server in the Docker image, so it's a good moment to take a look at it and set it up from scratch.
What is Healthchecks?
Healthchecks is an open-source cron job and background task monitoring service written in Python and Django. It lives on GitHub at healthchecks/healthchecks, has a little over 10,000 stars and is licensed under the BSD 3-Clause license. The same code powers the hosted service at healthchecks.io, but you can run your own instance with the official Docker image.
The idea is simple:
- You create a check in the web UI and get a unique ping URL.
- Your job calls that URL (for example with
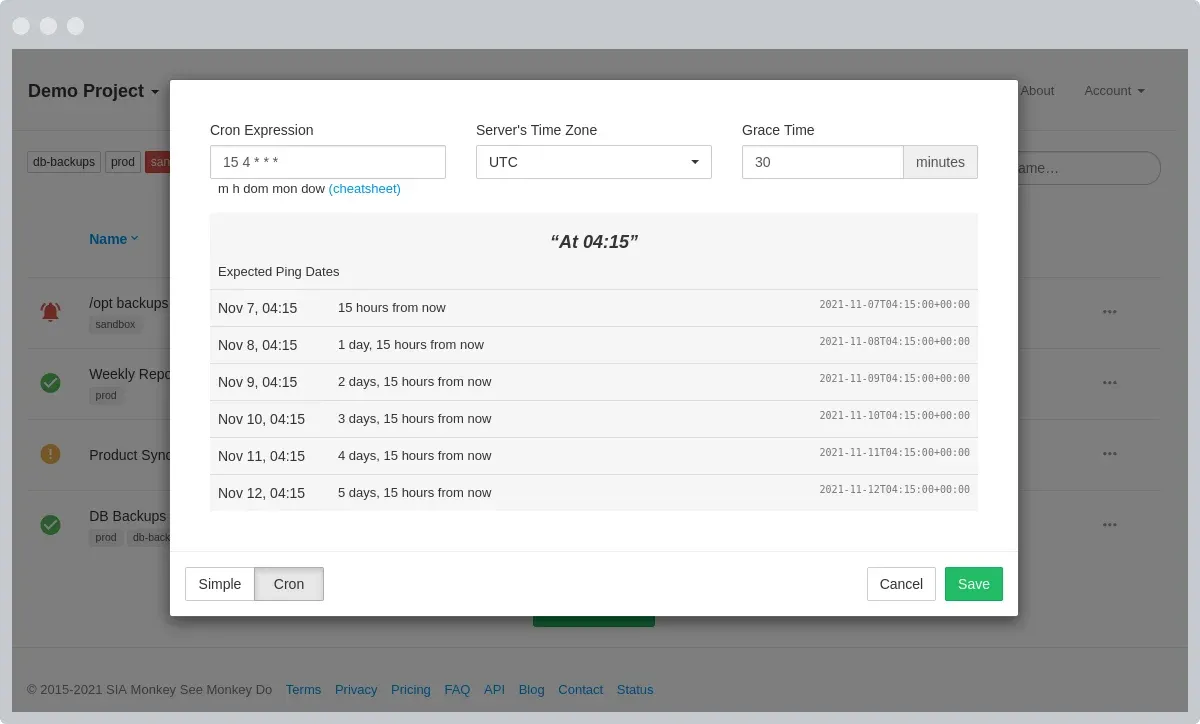
curl) every time it finishes. - You tell Healthchecks how often to expect a ping (Period) and how long to wait before raising the alarm (Grace Time), or you give it a cron expression.
- When a ping is late, Healthchecks marks the check as down and notifies you.
This is often called a "dead man's switch": silence is the signal.
Key features
According to the README and docs, Healthchecks comes with:
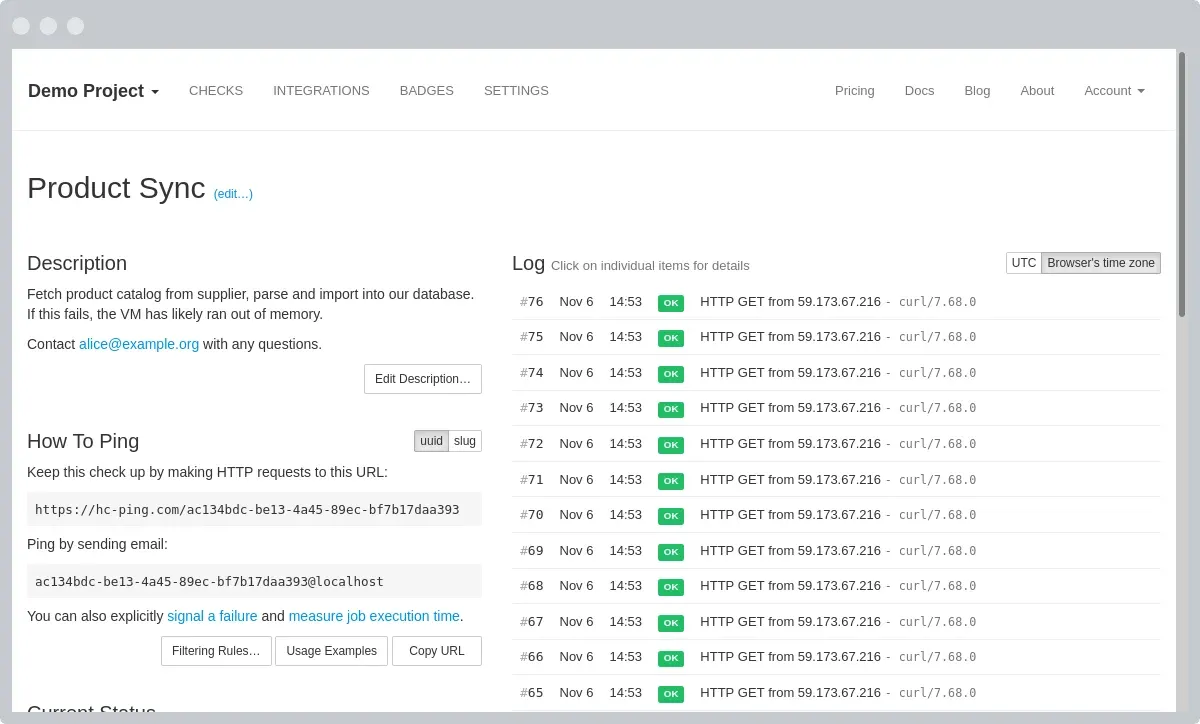
- A live-updating dashboard with tags, filters and a per-check event log.
- Simple period/grace schedules or cron expressions (parsed with the project's own
cronsimlibrary), including time zones. - Several signal types: success,
/start,/fail,/logand reporting a script's exit code directly, e.g./$?. - Run time measurement: send a
/startping and Healthchecks shows how long each run took. If a job starts but doesn't finish within the grace time, it's treated as failed. - Pinging by email via an optional built-in SMTP listener.
- 25+ integrations for notifications, including email, webhooks, Slack, Discord, Telegram, Matrix, ntfy, Pushover, Signal, PagerDuty and more, plus optional Apprise support.
- A Management API, status badges, monthly email reports, Prometheus metrics, projects and team members with read-only access, and WebAuthn 2FA.
- Database choice: SQLite (default), PostgreSQL, MySQL or MariaDB.
What's new in v5.0
The headline change in v5.0 is under the hood: the Docker image now uses gunicorn instead of uWSGI as its web server. That's why it's a major version, even though the app itself feels the same. A few things to know if you're upgrading, all from the release notes:
- If you use a customized
docker-compose.yml, thecommandmust now run/opt/healthchecks/run.shinstead ofuwsgi. - The number of web workers is set with
GUNICORN_WORKERS. If it's not set, the image falls back to the oldUWSGI_PROCESSES, and otherwise defaults to 4. - If any background process in the container (
sendalerts,sendreports,smtpd) crashes, the whole container now exits instead of restarting just that process. With a Docker restart policy, that means everything restarts cleanly together. - The Shell integration now passes data via environment variables and can be edited after creation, and email notifications handle SMTP connection errors more gracefully.
v5.0.1 added GUNICORN_PORT to change the listening port and GUNICORN_DISABLE_LOGGING to turn off the access log, and moved the image to a Python 3.14 base.
Why self-host it?
The hosted healthchecks.io service is perfectly fine for many people. Self-hosting makes sense when:
- you want to monitor jobs on machines that should never talk to a third-party service,
- you want unlimited checks and team members without plan limits,
- you already run a reverse proxy and a database, so one more small container is cheap,
- you like the idea of your monitoring data staying on your own hardware.
One honest caveat up front: a self-hosted monitor is only as reliable as the box it runs on. More on that below.
Installing Healthchecks with Docker Compose
The project ships a sample Compose file in the docker/ folder of the repository. The version below is based on it, but uses the pre-built image, pins the version, adds health-based startup ordering and keeps the database off the host network. It assumes you already run a reverse proxy that terminates TLS (Traefik labels are included as an example).
1. Create a folder and an .env file
mkdir -p /opt/healthchecks && cd /opt/healthchecks
Generate two random values, one for the database password and one for Django's secret key:
openssl rand -hex 24   # use for DB_PASSWORD
openssl rand -hex 50   # use for SECRET_KEY
Then create .env:
# Database
DB=postgres
DB_HOST=db
DB_PORT=5432
DB_NAME=hc
DB_USER=postgres
DB_PASSWORD=change-me

# Core
SECRET_KEY=change-me-too
SITE_ROOT=https://hc.example.com
SITE_NAME=My Healthchecks
DEBUG=False

# Private instance: no public sign-ups
REGISTRATION_OPEN=False

# WebAuthn 2FA (domain without scheme or port)
RP_ID=hc.example.com

# Outgoing email (needed for login links, alerts and reports)
DEFAULT_FROM_EMAIL=healthchecks@example.com
EMAIL_HOST=smtp.example.com
EMAIL_PORT=587
EMAIL_HOST_USER=healthchecks@example.com
EMAIL_HOST_PASSWORD=change-me-smtp
EMAIL_USE_TLS=True

# gunicorn (v5+)
GUNICORN_WORKERS=2
A few notes on these values, all from the official configuration docs:
ALLOWED_HOSTSis filled in automatically from the domain inSITE_ROOT, so you only need it if you serve the instance on several domains.PING_ENDPOINTdefaults toSITE_ROOT+/ping/, which is what you want behind a reverse proxy.REGISTRATION_OPEN=Falseis recommended for private instances that still need to be reachable from the internet so remote machines can ping them. You can still invite people into your projects.GUNICORN_WORKERS=2saves memory on small servers. The default is 4.
Lock the file down with chmod 600 .env.
2. Create docker-compose.yml
services:
  db:
    image: postgres:16
    restart: unless-stopped
    environment:
      - POSTGRES_DB=${DB_NAME}
      - POSTGRES_PASSWORD=${DB_PASSWORD}
    volumes:
      - db-data:/var/lib/postgresql/data
    healthcheck:
      test: ["CMD-SHELL", "pg_isready -U postgres -d ${DB_NAME}"]
      interval: 10s
      timeout: 5s
      retries: 5
    networks:
      - internal

  web:
    image: healthchecks/healthchecks:v5.0.1
    restart: unless-stopped
    env_file:
      - .env
    depends_on:
      db:
        condition: service_healthy
    networks:
      - internal
      - proxy
    labels:
      - traefik.enable=true
      - traefik.docker.network=proxy
      - traefik.http.routers.healthchecks.rule=Host(`hc.example.com`)
      - traefik.http.routers.healthchecks.entrypoints=websecure
      - traefik.http.routers.healthchecks.tls.certresolver=letsencrypt
      - traefik.http.services.healthchecks.loadbalancer.server.port=8000

volumes:
  db-data:

networks:
  internal:
  proxy:
    external: true
Adjust the network name, entrypoint and certificate resolver to match your own Traefik setup. If you don't use a reverse proxy and just want to try it locally, drop the labels and the proxy network and add ports: ["8000:8000"] to the web service instead.
The image runs as a non-root hc user, runs database migrations automatically on startup and has a built-in Docker health check, so docker compose ps will show whether it's healthy.
3. Start it and create an admin account
docker compose up -d
docker compose logs -f web
Once the migrations are done, create a superuser:
docker compose run --rm web /opt/healthchecks/manage.py createsuperuser
Open https://hc.example.com, log in and create your first check.
Reverse proxy: two headers matter
The Docker README is very clear on this, and it's easy to get wrong:
- Healthchecks uses
X-Forwarded-Prototo decide whether a request is HTTPS. If your proxy doesn't set it, you'll see "403 CSRF verification failed" errors when logging in. - It trusts
X-Forwarded-Forfor the client IP, which is used for things like rate limiting on the login form. Your proxy must set it and must not pass through a value supplied by the client.
Traefik sets both headers by default and, unless you explicitly configure it to trust forwarded headers from certain IPs, it doesn't keep client-supplied values. With NGINX you need proxy_set_header X-Forwarded-Proto $scheme; (and the usual X-Forwarded-For line) yourself.
Pinging your first job
Each check gets a URL like https://hc.example.com/ping/<uuid>. The simplest integration is one curl at the end of a cron job:
# crontab: run the backup at 03:00 and report success
0 3 * * * /usr/local/bin/backup.sh && curl -fsS -m 10 --retry 5 -o /dev/null https://hc.example.com/ping/your-uuid-here
Better: report the exit code, so failures are flagged immediately instead of after the grace time:
#!/bin/sh
/usr/local/bin/backup.sh
curl -fsS -m 10 --retry 5 -o /dev/null https://hc.example.com/ping/your-uuid-here/$?
And if you want run times, send a /start ping first:
#!/bin/sh
URL=https://hc.example.com/ping/your-uuid-here
curl -fsS -m 10 --retry 5 -o /dev/null "$URL/start"
/usr/local/bin/backup.sh
curl -fsS -m 10 --retry 5 -o /dev/null "$URL/$?"
Exit code 0 counts as success, anything from 1 to 255 as a failure. If you send a POST request, Healthchecks stores the request body (up to PING_BODY_LIMIT, 10,000 bytes in the sample config), which is handy for attaching the last lines of a log.
Instead of UUIDs, you can also use slugs with a project ping key (/ping/<ping-key>/<slug>). With ?create=1, a check is even created automatically on its first ping, which is nice for provisioning many machines with Ansible.
Configuration tips
- Set up email first. Login links, email alerts and monthly reports all depend on working SMTP. Use the
_FILEvariants (for exampleDB_PASSWORD_FILEorEMAIL_HOST_PASSWORD_FILE) if you prefer Docker secrets over plain env vars. - Enable 2FA. Set
RP_IDto your domain and register a security key or passkey under your account settings. - Leave the Shell integration off unless you fully trust every user. It runs local commands with the permissions of the alerting process, which is why
SHELL_ENABLEDdefaults toFalse. - Private IPs for webhooks are blocked by default (
INTEGRATIONS_ALLOW_PRIVATE_IPS=False). If you want to send webhooks to services in your LAN, you have to opt in, and you should understand why that default exists. - ntfy, Gotify or Matrix make great notification targets in a homelab. Apprise is available too (
APPRISE_ENABLED=True, the package is already included in the official image). - Show status on your dashboard. If you use Homepage, it has a built-in Healthchecks widget that shows total up/down counts or a single check, using a read-only API key from your project settings.
- Back up the database. A regular
pg_dumpof thedbcontainer is enough, and of course you can monitor that backup job with Healthchecks itself.
Limitations and honest notes
- Who watches the watcher? If the machine running Healthchecks goes down, you won't get alerts about anything. Many people pair a self-hosted instance with an external uptime check on the Healthchecks URL itself, or run it on a different machine than the jobs it monitors.
- It's not an uptime monitor. Healthchecks doesn't actively probe websites or ports. For that you still want something like Uptime Kuma or your existing monitoring.
- Email is practically mandatory. You can run it without SMTP, but logins, invites and email alerts won't work properly.
- The v5 upgrade can break custom setups. If your Compose file still calls
uwsgi, update it to/opt/healthchecks/run.shbefore pulling v5. - The sample Compose file is minimal. As the project itself notes, it's a single database and a single web node on one host, without TLS. That's fine for a homelab, but it's not a high-availability setup.
Healthchecks vs. Uptime Kuma
Both are popular in homelabs, and they complement each other rather than compete. Uptime Kuma (MIT) is primarily an active uptime monitor: it checks HTTP(s), TCP, DNS, ping, Docker containers and more. It also has a Push monitor type where a job calls a URL, similar to Healthchecks' basic ping.
Healthchecks focuses entirely on that "push" side and goes much deeper there: cron expressions with time zones, start/fail/exit-code signals, run time tracking, ping bodies, email pings, slugs with auto-provisioning and a full management API. If cron jobs and backups are what you worry about, Healthchecks is the more specialized tool. If you mainly want to know whether your websites are reachable, start with Uptime Kuma.
Conclusion
Healthchecks is one of those tools that seems almost too simple at first: a URL, a timer and an alert. But that simplicity is exactly why it works. It catches the failures nobody notices, like a backup that stopped three weeks ago or a certificate renewal that quietly broke. The v5 release modernizes the Docker image without changing what makes the app good, and with a small Postgres container and a reverse proxy, it's up and running in a few minutes.
If you only add one thing to your homelab this weekend, make it a ping at the end of your backup script.
Looking for more self-hosted tools? Check out our posts on Termix, the self-hosted SSH and server management app, and the open source trends of October 2026.