Uptime Kuma 2.5: What's New in v2 and How to Run It with Docker Compose
Uptime Kuma is the go-to self-hosted uptime monitor. Version 2 brings MariaDB support, slim and rootless images and faster charts. Here is how to run 2.5.9 with Docker Compose and upgrade safely from v1.
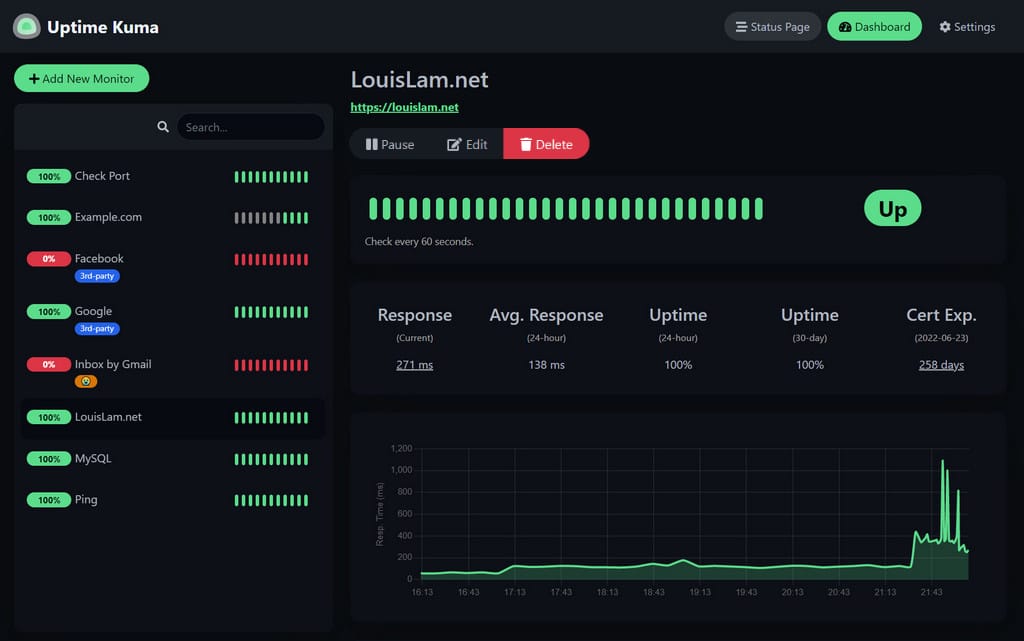
If you self-host anything, you have probably heard of Uptime Kuma. With more than 90,000 GitHub stars it is one of the most popular self-hosted projects of all time, and for good reason: it is the easiest way to get a good-looking "is my stuff up?" dashboard, alerts on your phone and public status pages.
Version 2 was in beta for a long time. The stable 2.0.0 finally landed in October 2025, and since then the 2.x line has matured quickly. The current release is 2.5.9 (31 October 2026). In this guide we look at what changed in v2, which Docker image to pick, and how to run (or upgrade to) Uptime Kuma 2 with Docker Compose.
What is Uptime Kuma?
Uptime Kuma is a self-hosted monitoring tool written in Node.js and Vue, released under the MIT license. You add monitors, Kuma checks them at a fixed interval (down to 20 seconds) and notifies you when something goes down or comes back.
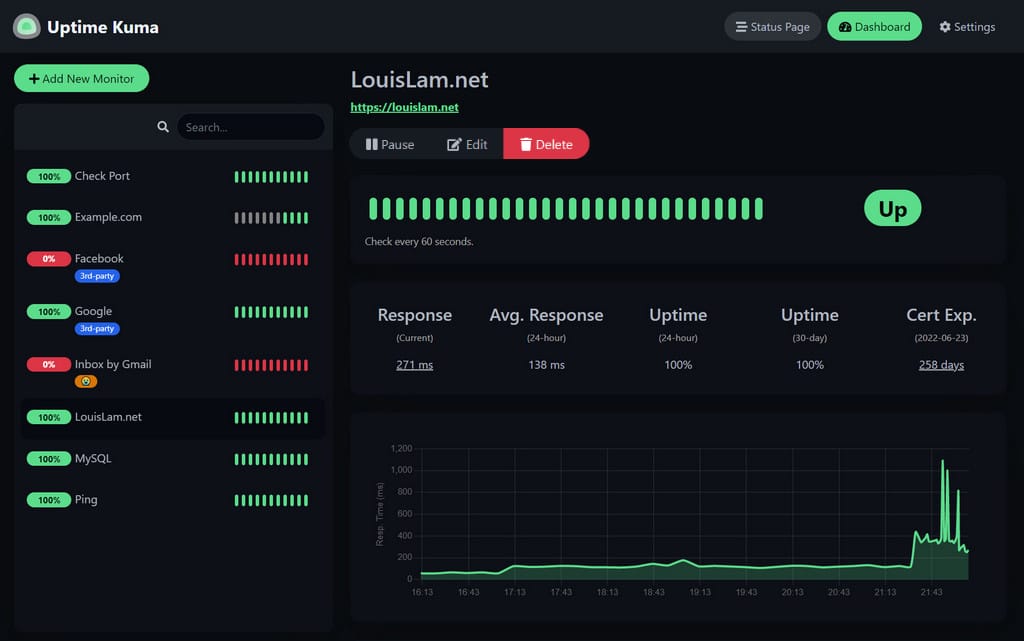
Supported monitor types include:
- HTTP(s), including keyword checks and JSON queries on the response
- TCP port, ping, DNS record and WebSocket
- Push monitors, where your script calls Kuma instead of the other way round
- Docker containers, game servers (Steam/GameDig) and more, such as MQTT, SNMP, RabbitMQ, databases and, since 2.5.4, SFTP
On top of that you get 90+ notification providers (Telegram, Discord, Gotify, ntfy, Slack, email and many more), multiple status pages that can be mapped to their own domains, certificate expiry info, proxy support and 2FA.
What's new in Uptime Kuma 2
The v2 changelog is long. These are the changes that matter most for homelabs:
- MariaDB support. Besides SQLite you can now use an external MariaDB or the embedded MariaDB that ships in the full Docker image. That makes Kuma much happier with hundreds of monitors.
- Faster, aggregated statistics. Heartbeats are aggregated into a new, more efficient format, so charts and uptime percentages load much faster on large installations.
- New image variants. There are now
slimandrootlesstags (details below). - Remote browser support for the "real browser" monitor type, so the Chromium-based check can run elsewhere.
- More monitor types, for example SNMP, RabbitMQ and conditions for DNS monitors, plus a basic RSS feed for status pages.
- CLI password reset without user interaction.
- Templated email notifications using LiquidJS.
The 2.5 releases since August 2026 added things like unlimited check intervals (previously capped at 24 days), an SFTP monitor and more notification providers.
Security fixes: update to 2.5.9
The last two releases are security-relevant, so if you run an older 2.x version, update now:
- 2.5.8 (26 October 2026) fixed an authenticated, admin-only remote code execution via argument injection in the Apprise notification integration (advisory GHSA-v2p3-6f5h-6hhf). It also turned all "TCP port with TLS" monitors into normal TCP monitors, because that option never worked reliably.
- 2.5.9 (31 October 2026) fixed an RSS cache poisoning issue (GHSA-86ch-2247-gr56) and several bugs, including push monitor retries.
Which Docker image should you use?
The old latest tag is deprecated and still points to v1. If your Compose file says louislam/uptime-kuma:latest or :1, you are not on v2. The recommended tags are:
| Tag | What you get |
|---|---|
2 |
Latest v2, full image (recommended) |
2-slim |
Latest v2 without the extras |
2.5.9 / 2.5.9-slim |
Pinned to a specific release |
2-rootless, 2-slim-rootless |
Runs without root; some features may not work |
The full image includes Chromium (for the real-browser monitor), extra fonts and the embedded MariaDB server. The slim image leaves those out. If you only need HTTP, ping, TCP and Docker checks with SQLite, 2-slim is a good, smaller choice.
Installing Uptime Kuma 2 with Docker Compose
The official compose.yaml is tiny. Here is the same thing with a pinned version:
mkdir -p /opt/uptime-kuma && cd /opt/uptime-kuma
nano compose.yaml
services:
  uptime-kuma:
    image: louislam/uptime-kuma:2.5.9
    container_name: uptime-kuma
    restart: unless-stopped
    volumes:
      - ./data:/app/data
      # optional: allow Docker container monitors
      # - /var/run/docker.sock:/var/run/docker.sock:ro
    ports:
      - "127.0.0.1:3001:3001"
docker compose up -d
Binding to 127.0.0.1 keeps Kuma off your LAN until you put a reverse proxy in front of it; use "3001:3001" if you want to open it directly. On first start, Kuma asks you to pick the database (SQLite, embedded MariaDB or external MariaDB) and create the admin account.
Important: do not put the data directory on NFS or another network file system. The project explicitly does not support that. Use a local directory or Docker volume.
Behind Traefik
The upstream wiki has Traefik labels. Adapted to a typical setup with a websecure entrypoint and a shared traefik network, it looks like this (and replaces the ports: section):
    networks:
      - traefik
    labels:
      - traefik.enable=true
      - traefik.http.routers.uptime-kuma.rule=Host(`status.example.com`)
      - traefik.http.routers.uptime-kuma.entrypoints=websecure
      - traefik.http.routers.uptime-kuma.tls.certresolver=letsencrypt
      - traefik.http.services.uptime-kuma.loadbalancer.server.port=3001
Kuma's UI runs over WebSockets. Traefik handles that automatically; if you use Cloudflare in front, make sure WebSockets are enabled there.
Upgrading from v1 to v2
The upgrade is a one-way database migration, so treat it with respect. From the official migration guide:
- Stop the container and back up the
datadirectory (the guide literally says to do it three times). - Change the image to
louislam/uptime-kuma:2(or a pinned 2.x tag). Don't switch to a rootless image during the upgrade; that is known to cause startup issues. - Start it and watch the logs with
docker logs -f uptime-kuma. The heartbeat table is aggregated into the new format. The maintainer reports about 7 minutes for 20 monitors with 90 days of data; on slow hardware it can take hours. - Never interrupt the migration. If it is interrupted, restore your backup and start again.
Breaking changes to be aware of:
- The JSON backup/restore feature was removed. Backing up the
datadirectory is now the only supported backup method. - Alpine-based images are gone, and on Debian/Raspbian Buster hosts v2 can fail to start because of a libseccomp2 bug.
- Badge endpoints only accept durations like
24h,30dor1y. - Email templates now use LiquidJS: variables are case-sensitive.
- New monitors default to 0 retries instead of 1.
Notifications that reach your phone
Kuma supports both of the push servers we covered recently. Add a notification under Settings > Notifications, choose ntfy or Gotify, and enter your server URL and topic or app token. See our guides on ntfy and Gotify for the server side. Tick Default enabled so new monitors use it automatically.
Status pages
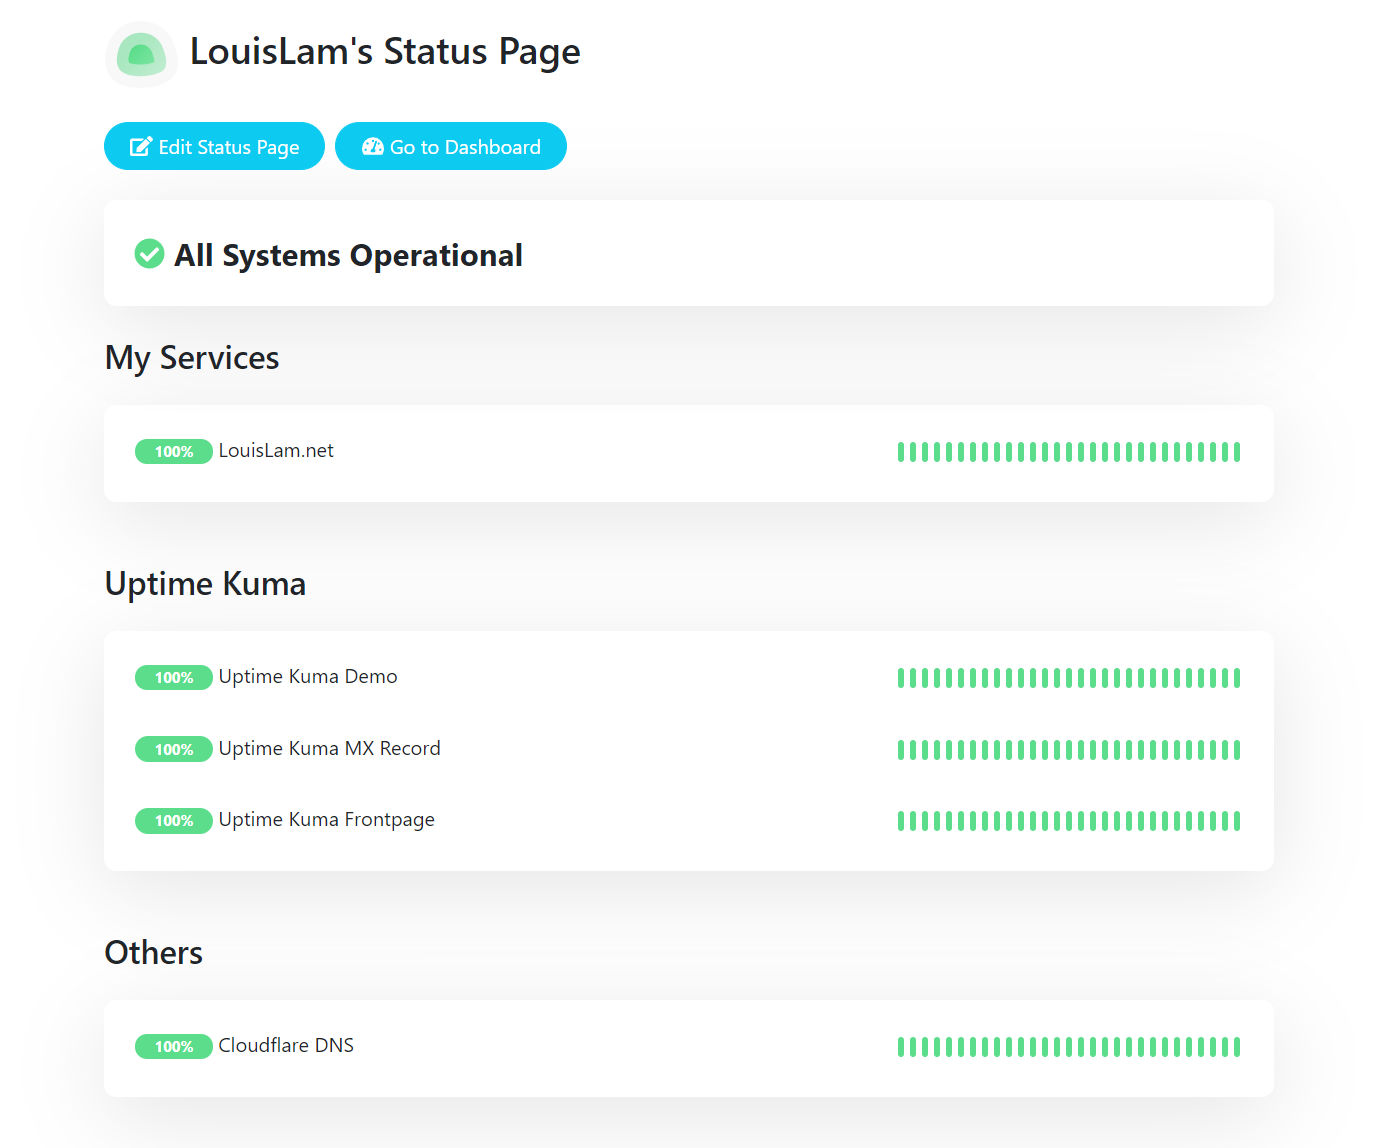
Status pages are one of Kuma's best features. You can create several, group monitors on each, add a logo, a description and incident messages, and map each page to its own domain.
Tips from practice
- Monitor from the outside, too. A Kuma instance on the same server as your services cannot tell you that the server itself is down. A second, tiny instance on a cheap VPS (or at a friend's house) watching your main one solves that.
- Use push monitors for jobs. For backups and cron jobs, a push monitor works, but Healthchecks is built for exactly that, with cron schedules and grace times.
- Combine with resource monitoring. Kuma tells you that something is down; Beszel shows you why (full disk, RAM, a crashed container).
- Watch content, not only status codes. For "did this page change?" use changedetection.io instead of keyword monitors.
- Show it on your dashboard. Homepage has an Uptime Kuma widget for status pages.
Uptime Kuma vs the alternatives
| Uptime Kuma | Healthchecks | Gatus | |
|---|---|---|---|
| Checks | Active checks (HTTP, TCP, DNS, ping, …) and push | Passive (your job pings it) | Active checks defined in YAML |
| Configuration | Web UI | Web UI | Config file (GitOps-friendly) |
| Status pages | Yes, multiple, custom domains | No public status page | Yes |
| Best for | Most homelabs | Cron jobs and backups | Infrastructure-as-code fans |
Conclusion
Uptime Kuma 2 is a big step up: faster charts, MariaDB for larger setups and leaner image options, while staying just as easy to use. If you are still on latest (which means v1), plan the upgrade with a proper backup. If you are already on 2.x, update to 2.5.9 for the latest security fixes.